
Tendencias en la disciplina de la Visualización de Información
DOI:
https://doi.org/10.3145/thinkepi.2022.e16a02Palabras clave:
Visualización de la información, 2022, Comunicación visual, Tendencias, Visualización de datos, Visualización interactiva, Infografía, Visualizaciones multimedia, Tecnologías de análisis de datos, Recursos visualesResumen
Panorámica sobre la evolución de la disciplina de la visualización de la información durante 2021. Por un lado, se presentan propuestas que han destacado por incorporar innovaciones respecto a los conceptos y recursos visuales. Por otro, se recogen algunos ejemplos de visualizaciones que han llamado la atención, no tanto por sus aportaciones visuales, sino por el conjunto de datos y contenidos que han representado. Por último, para completar esa visión de la evolución anual de la disciplina, se analizan algunos avances relacionados con el desarrollo tecnológico que se ha producido en el campo de la visualización de información.
Referencias
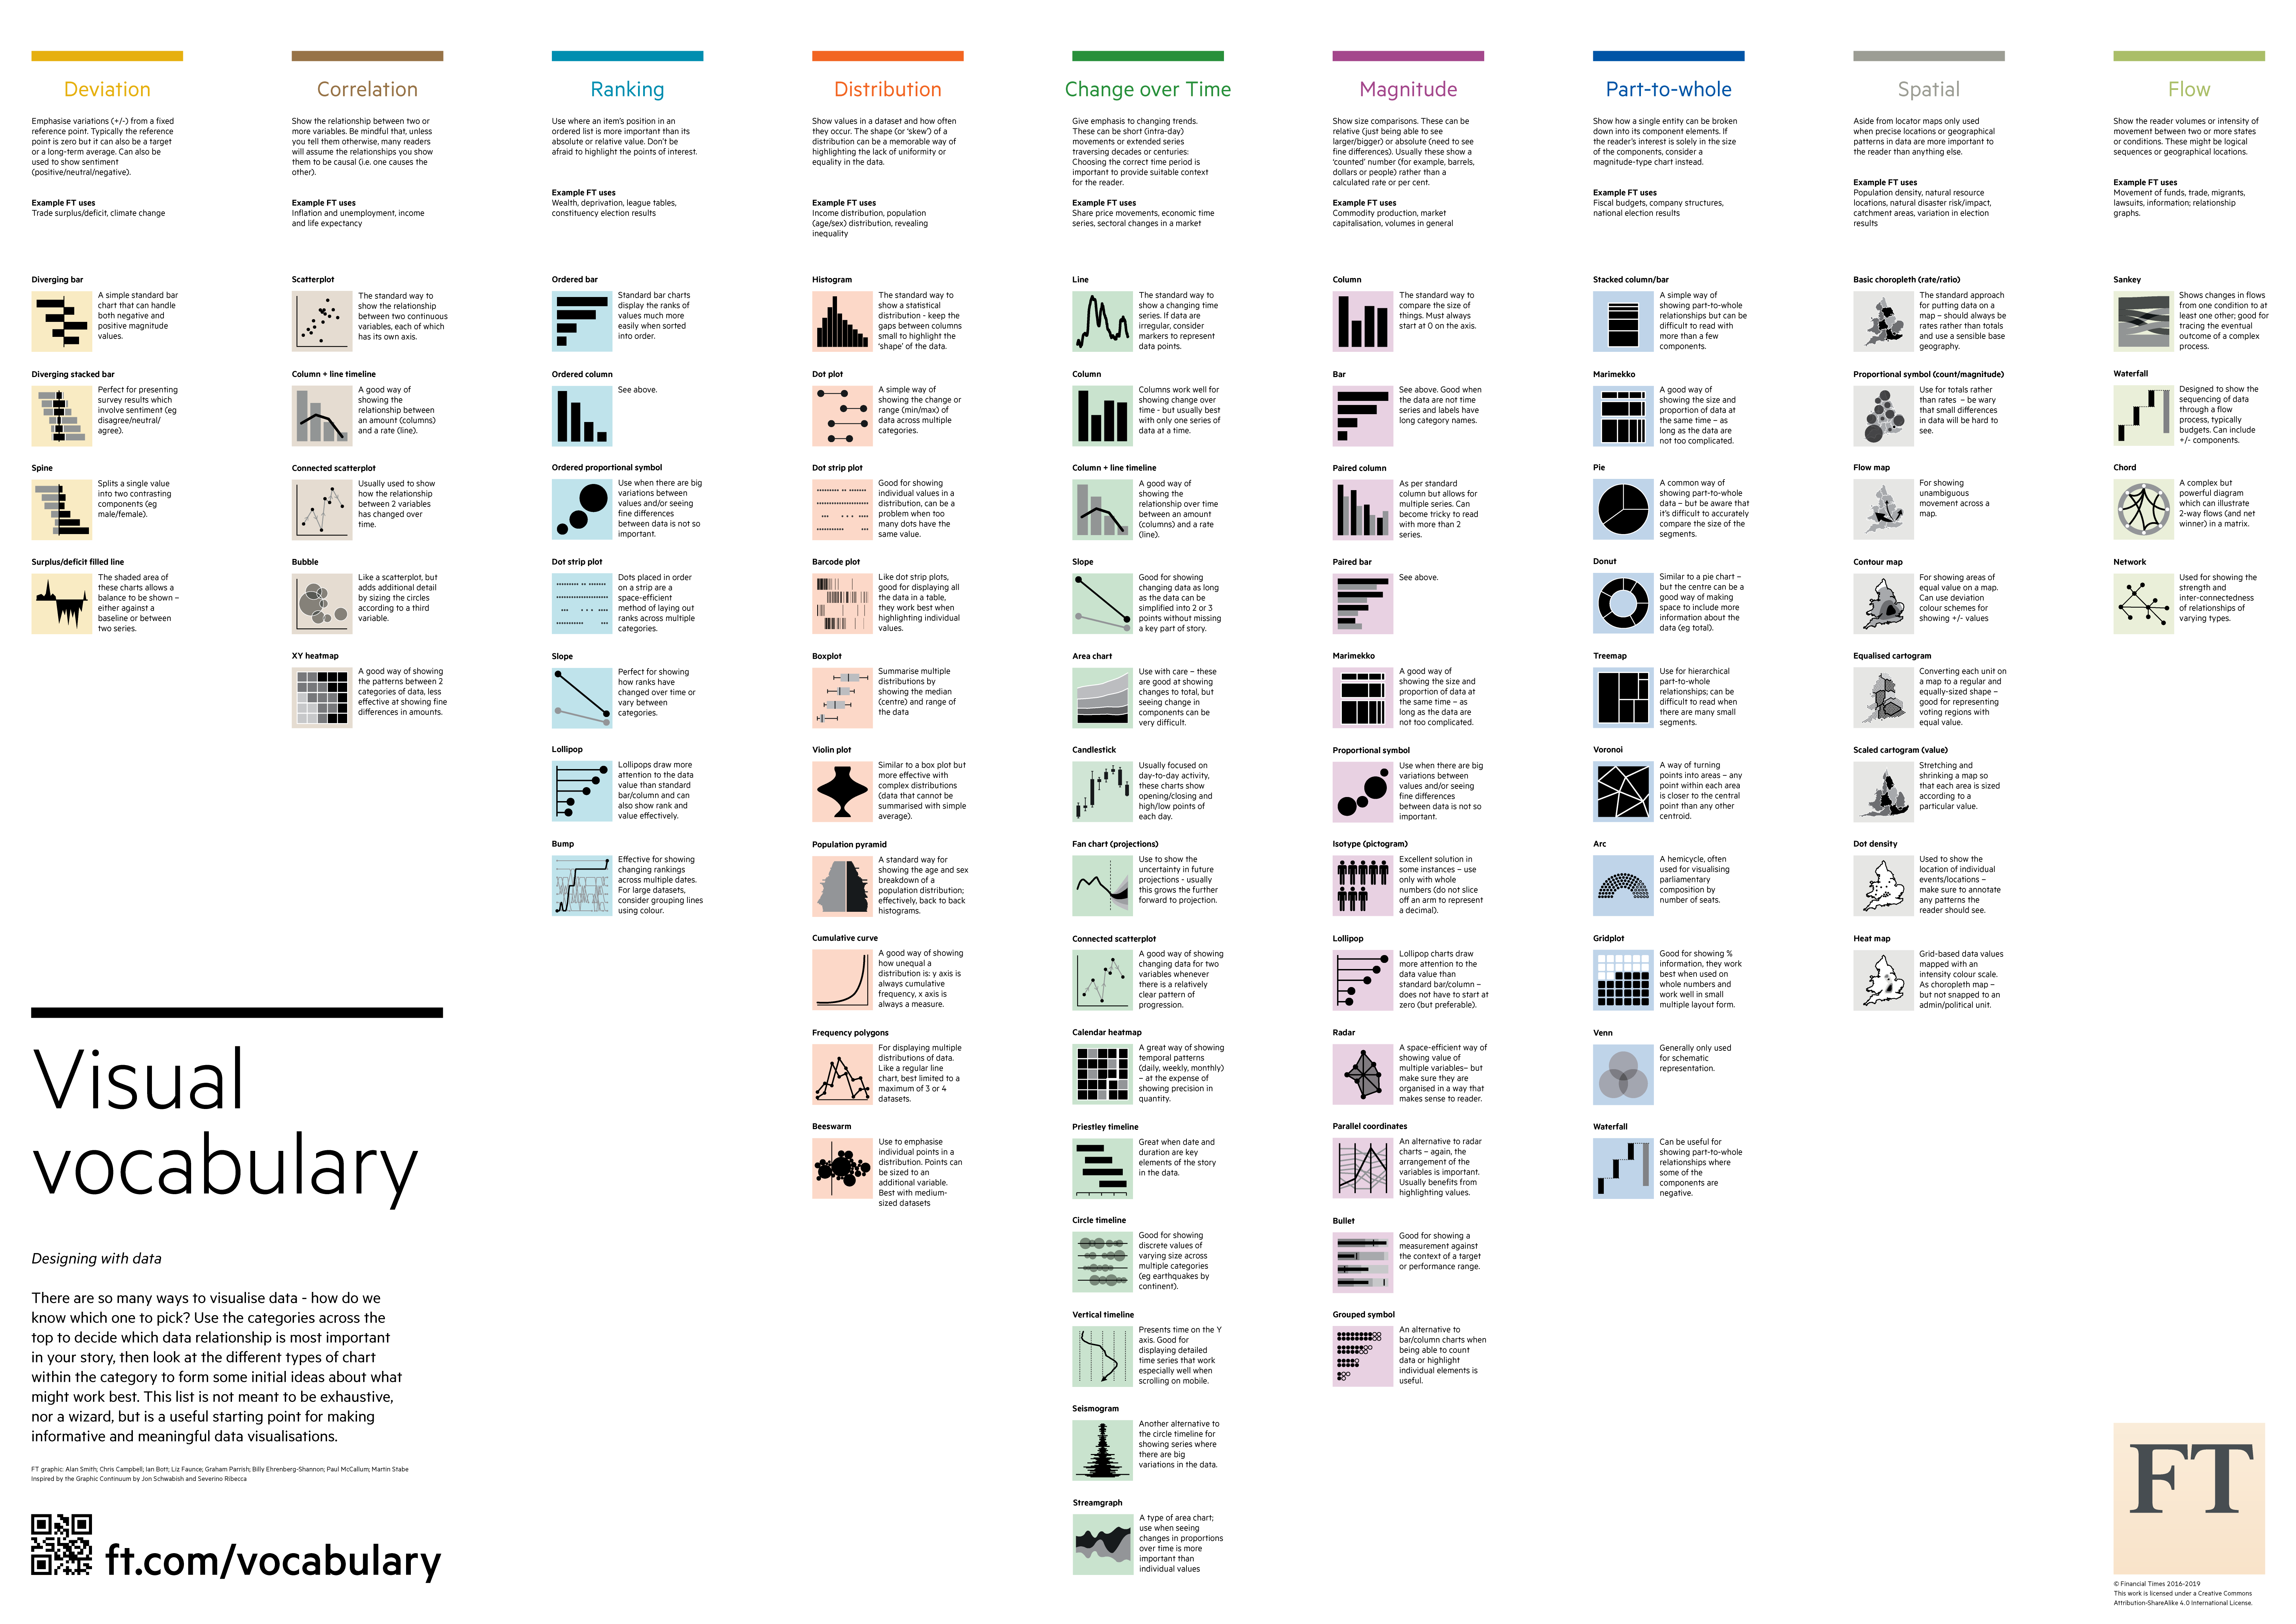
Financial Times visual vocabulary (2018). https://raw.githubusercontent.com/ft-interactive/chart-doctor/master/visual-vocabulary/poster.png
Flourish (2021). "How to visualize the Olympics". Flourish, 23 July. https://flourish.studio/blog/olympics-tokyo-2021
Investigate.ai (2021). "Practical data science for journalists (and everyone else)". Investigate.ai. https://investigate.ai
Kessler, Glenn; Kelly, Meg; Rizzo, Salvador; Shapiro, Leslie; Domínguez, Leo (2021). "A term of untruths. The longer Trump was president, the more frequently he made false or misleading claims". The Washington post, 23 Jan. https://www.washingtonpost.com/politics/interactive/2021/timeline-trump-claims-as-president/
Baden, Lindsey, R.; El-Sahly, Hana M.; Essink, Brandon; Kotloff, Karen; Frey, Sharon; Novak, Rick; Diemert, David; Spector, Stephen; Rouphael, Nadine; Creech, Buddy; McGettigan, John; Khetan, Shishir; Segall, Nathan; Solis, Joel; Brosz, Adam; Fierro, Carlos; Schwartz, Howard; Neuzil, Kathleen; Corey, Lawrence; Gilbert, Peter; Janes, Holy; Follmann, Dean; Marovich, Mary; Mascola, John; Polakowski, Laura; Ledgerwood, Julie; Graham, Barney S.; Bennett, Hamilton; Pajon, Rolando; Knightly, Conor; Leav, Brett; Deng, Weiping; Zhou, Honghong; Han, Shu; Ivarsson, Melanie; Miller, Jacqueline; Zaks, Tal (2021). "Efficacy and safety of the mRNA-1273 SARS-CoV-2 vaccine". The New England journal of medicine, v. 384, p. 403-416. https://doi.org/10.1056/NEJMoa2035389
MacInnes, Jeff (2021). "Following the science". The pudding. https://pudding.cool/2021/03/covid-science
Pérez-Montoro, Mario (2021). "Comunicación visual de una emergencia sanitaria mundial: el caso del Covid-19". Anuario ThinkEPI, v. 15, e15d01. https://doi.org/10.3145/thinkepi.2021.e15d01
Polack, Fernando P.; Thomas, Stephen J.; Kitchin, Nicholas; Absalon, Judith; Gurtman, Alejandra; Lockhart, Stephen; Perez, John L.; Pérez-Marc, Gonzalo; Moreira, Edson D.; Zerbini, Cristiano; Bailey, Ruth; Swanson, Kena A.; Roychoudhury, Satrajit; Koury, Kenneth; Li, Ping; Kalina, Warren V.; Cooper, David; Frenck, Robert W.; Hammitt, Laura L.; Tí¼reci, í–zlem; Nell, Haylene; Schaefer, Axel; íœnal, Serhat; Tresnan, Dina B.; Mather, Susan; Dormitzer, Philip R.; Åžahin, UÄŸur; Jansen, Kathrin U.; Gruber, Willliam C. (2020). "Safety and efficacy of the BNT162b2 mRNA Covid-19 vaccine". The New England journal of medicine, v. 383, p. 2603-2615. https://doi.org/10.1056/NEJMoa2034577
Rakich, Nathaniel; Mithani, Jasmine (2021). "What absentee voting looked like in all 50 states". FiveThirtyEight, Feb 9. https://fivethirtyeight.com/features/what-absentee-voting-looked-like-in-all-50-states
RCharts (2021). https://r-charts.com
Rubin, Benjamin (2021). Twitter. https://twitter.com/benjamin_rubin
Sánchez, Raúl; Plaza, Analía (2021). "España vive en pisos: por qué hemos construido nuestras ciudades en vertical". Eldiario.es. https://especiales.eldiario.es/espana-vive-en-pisos
IPCC (2021). The Intergovernmental Panel on Climate Change. https://interactive-atlas.ipcc.ch/regional-information
The New York times (2021). Portada del 21 de febrero de 2021. https://static01.nyt.com/images/2021/02/21/nytfrontpage/scan.pdf
The Washington post (2021). "In four years, President Trump made 30,573 false or misleading claims". The Washington post, Jan 20. https://www.washingtonpost.com/graphics/politics/trump-claims-database/?itid=lk_interstitial_manual_9
Tufte, Edward R. (1990). Envisioning information. Cheshire: Graphics Press.
UpSet (2020). https://upset.app/#upset-vs-venn-diagrams
Descargas
Descargas
Publicado
Cómo citar
Dimensions
